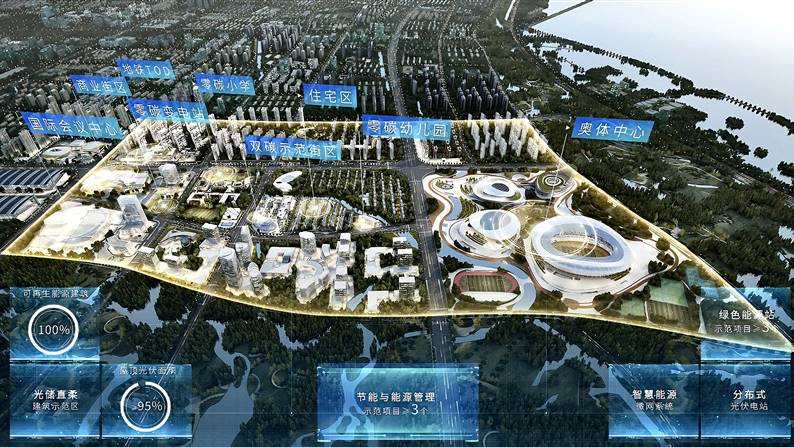

Could not see the "carbon", not through the analysis of the large data precision, also can become erratically, diameter tube. Recently, Hikvision officially launched the "double carbon brain" to assist relevant departments in making macro decisions and carry out energy conservation and emission reduction work purposefully and effectively. Through the four functions of "carbon map, carbon footprint, carbon management, and carbon neutralization", we can realize the scientific and efficient realization of "seeing carbon, analyzing carbon, managing carbon, and sequestration carbon" through the "big screen".
Carbon maps: Open up the big picture。In order to achieve the dual carbon target, the relevant government departments first need to understand the dynamics of the "big emitters". How do industries, energy, transportation and household life rank in terms of carbon emissions What is the energy mix on the consumption side What are the carbon emissions of different cities.
These are questions that once required a lot of people to answer. Now a "map" can provide the answers. Through the "carbon map" function of "Double carbon brain", relevant departments can view the proportion of carbon emissions in each province, city and district in one map. Just click to switch the region under their jurisdiction, they can view the total and intensity of carbon emissions. Based on the macro level, they can understand the data of different dimensions, so that carbon emissions can be clearly seen.
看不见摸不着的“碳”,通过精密的大数据分析,也能变得有迹可循、有径可管。近日,海康威视正式推出“双碳大脑”,辅助相关部门宏观决策,有目的、有成效地开展节能减排工作。通过“碳地图、碳足迹、碳管理、碳中和”四大功能,即可透过大屏“智”理双碳,科学高效地实现“看碳、析碳、管碳、汇碳”。
碳地图:打开全局视野
为达到双碳目标,政府相关部门首先需要了解碳排放“大户”们的动态。工业、能源、交通、居民生活等领域的碳排放排名情况如何消费侧能源结构怎样不同城市各自的碳排放量是多少。
以往,这些问题需要许多人力去排查,而现在一张“地图”就可以呈现答案。通过“双碳大脑”的“碳地图”功能,相关部门可以“一图”查看全省、各市、各区的碳排放占比情况,只需点击切换所管辖区域,就能查看碳排放总量和强度,基于宏观层面洞悉不同维度的数据,实现碳排放看得清。

零废弃学校建设之厨余垃圾篇
10-24 · 来源:中国浙江省宁波市鄞州第二实验中学 · 作者:中国浙江省宁波市鄞州第二实验中学

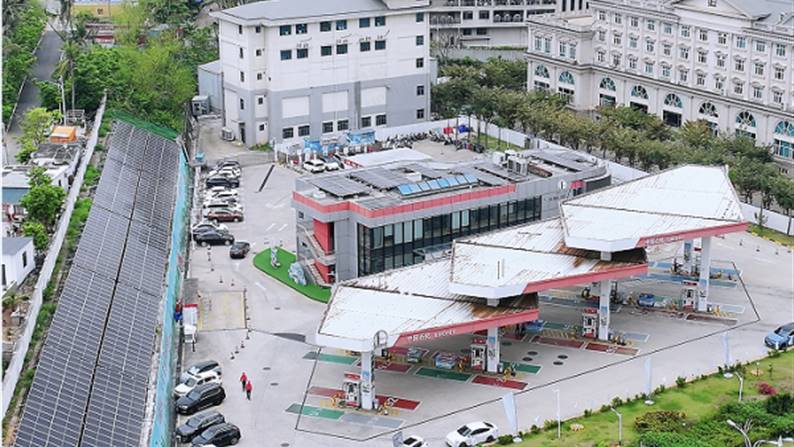
能源至净,生活至美,积极打造碳中和
10-24 · 来源:中国石化销售股份有限公司海南海口石油分公司 · 作者:中国石化销售股份有限公司海南海口石油分公司

无锡中瑞低碳生态城
10-23 · 来源:无锡中瑞低碳生态城 · 作者:无锡中瑞低碳生态城